Building dashboard content
Creating a custom dashboard makes it appear in the navigation, but a new dashboard opens empty. Its content is a layout of widgets — numbers, charts and tables — that you arrange on a grid. This page covers building that layout.
Each widget draws its figures from one of Centro's datasets, so a dashboard can bring together orders, stays, occupancy, QR activity and more on a single screen. You build the layout once; everyone whose role can see the dashboard then views it in read-only mode, with the latest figures.
Opening the layout builder
- Go to General Settings → Customisation → Custom dashboards.
- Select Edit on the dashboard you want to build.
- Open the Content tab.
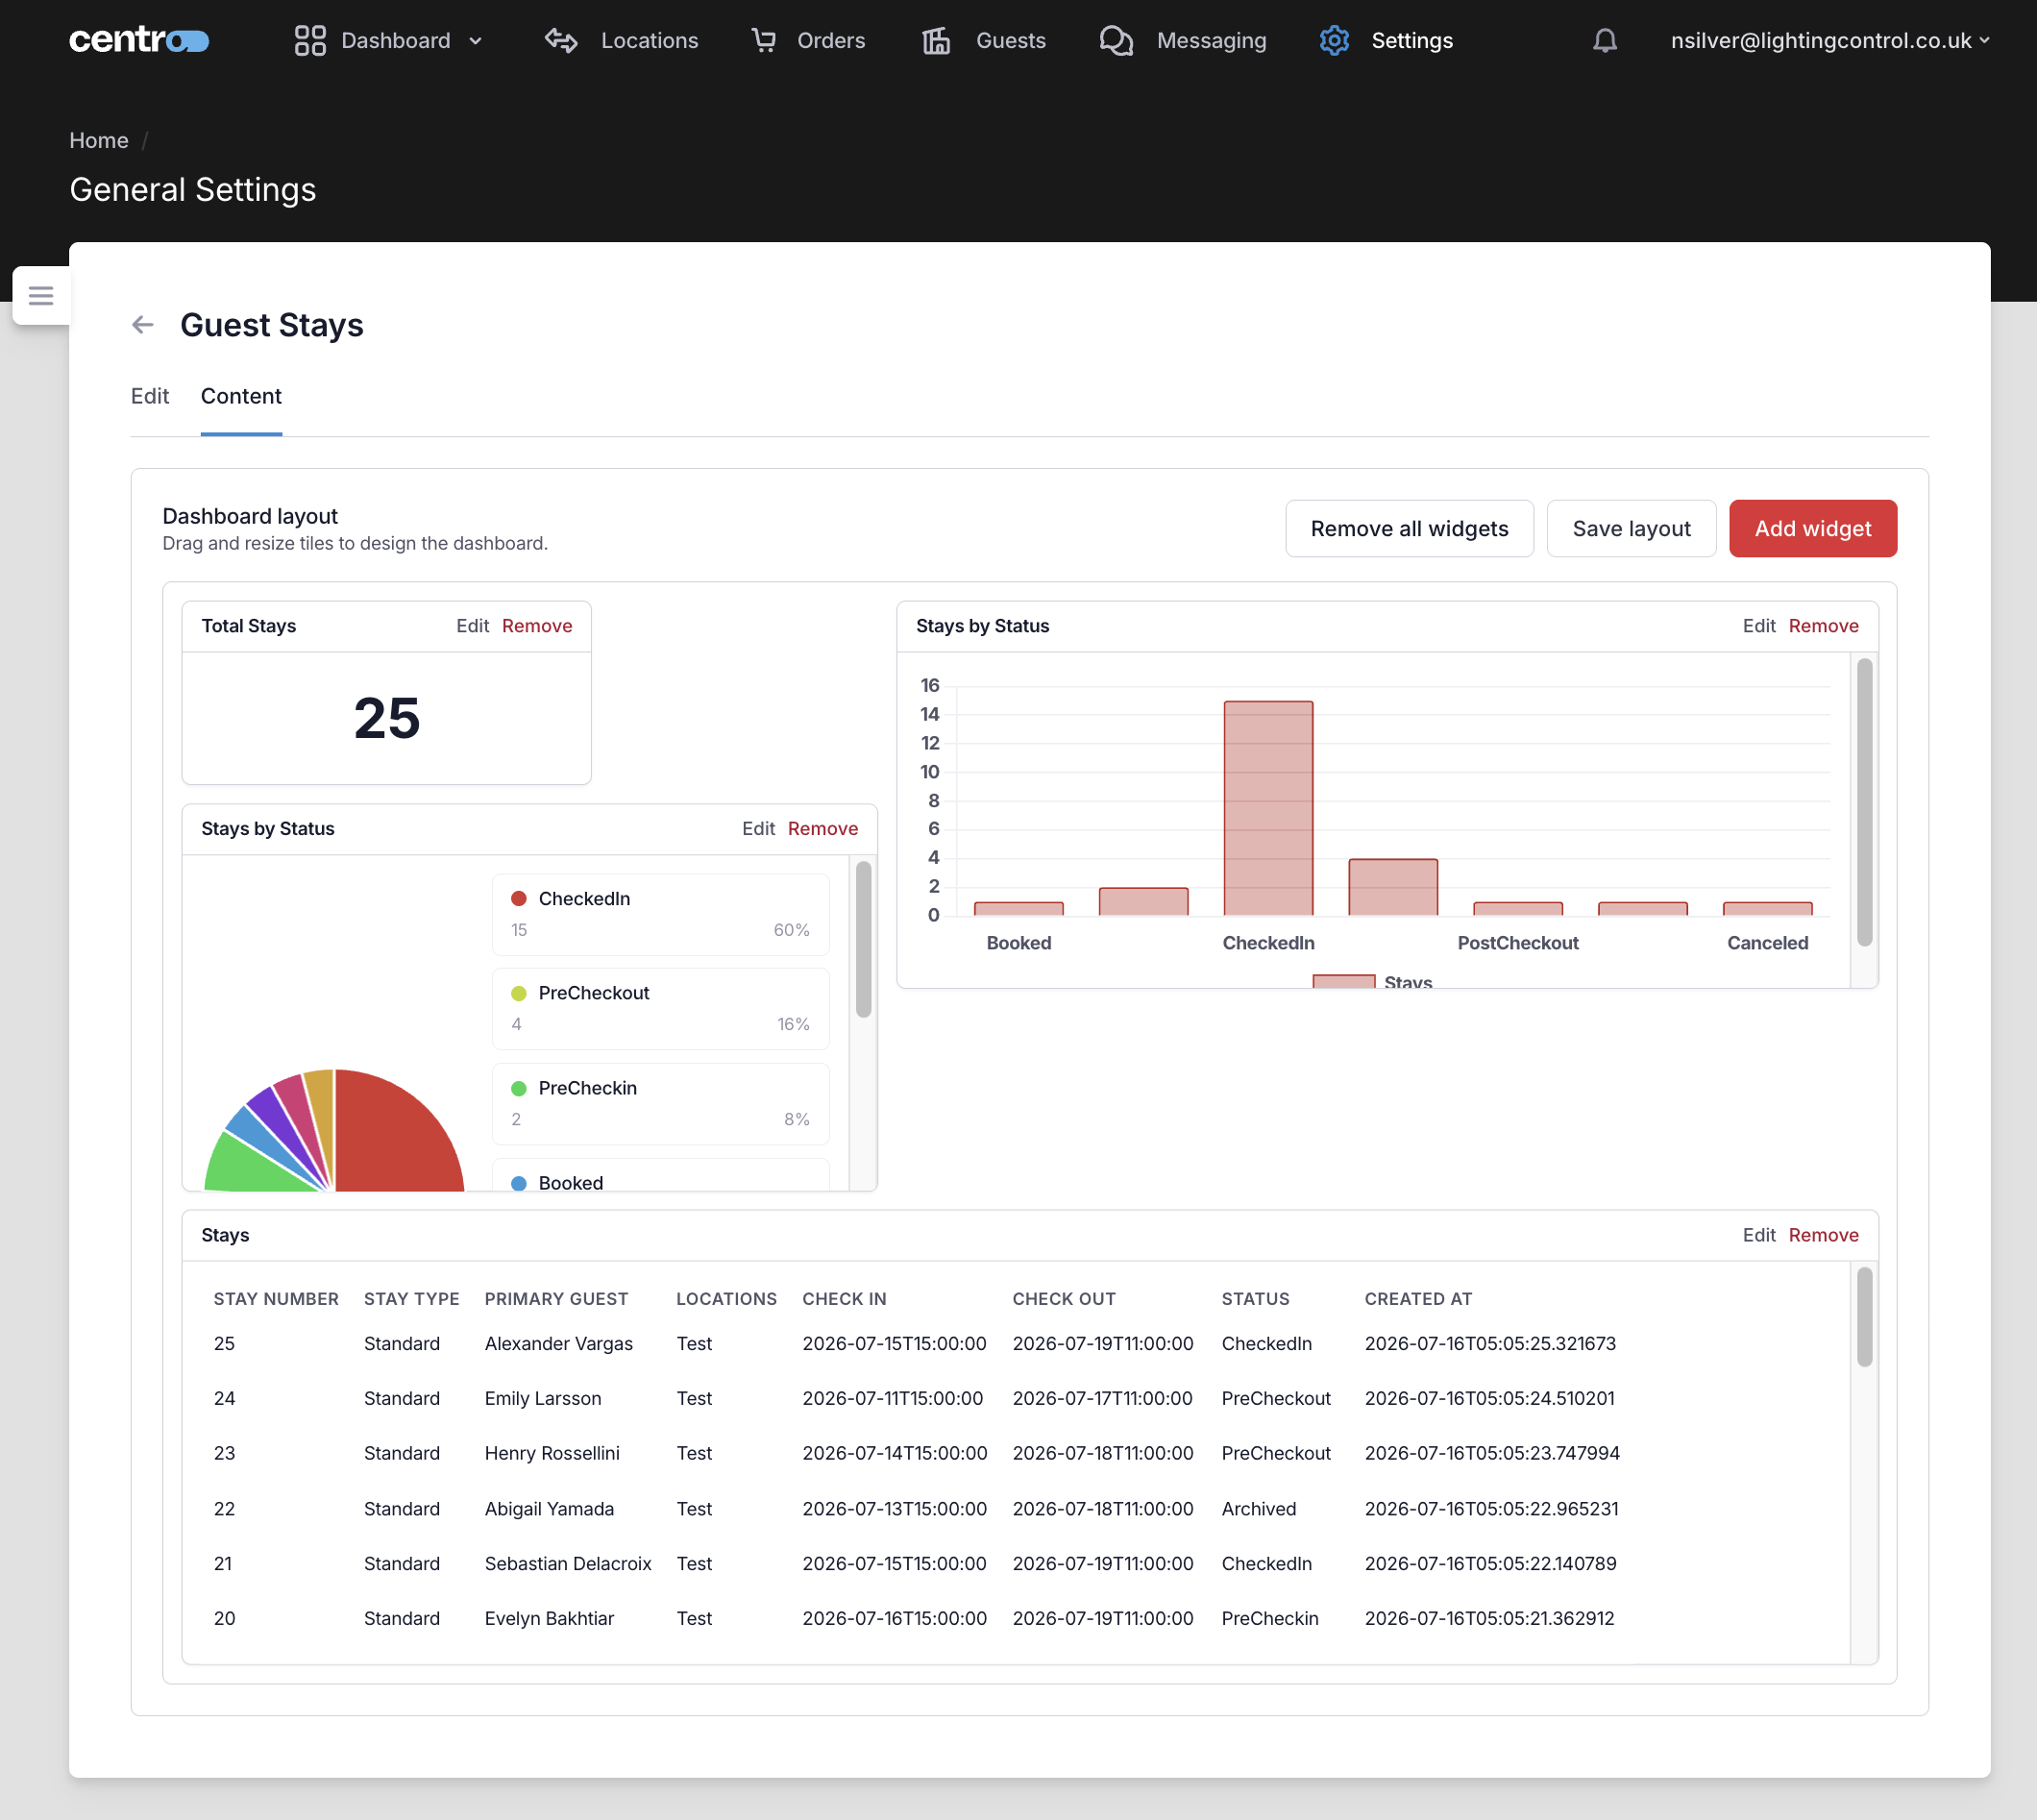
The Dashboard layout builder opens. This is the editing view — you can add, arrange and remove widgets here. Users who open the dashboard from their navigation see the same layout as a read-only view.
Starting from a template
The quickest way to begin is with one of the prebuilt templates. Select the template menu and choose one:
- Use general template — a cross-section of orders, revenue, stays and QR activity.
- Use revenue template — revenue and order-value figures with supporting charts.
- Use orders template — order status, timings and throughput.
- Use stays template — stay counts and status for hospitality deployments.
A template fills the canvas with a ready-made set of widgets that you can then adjust, add to or remove. To clear the canvas and start from nothing, select Remove all widgets.
Adding a widget
-
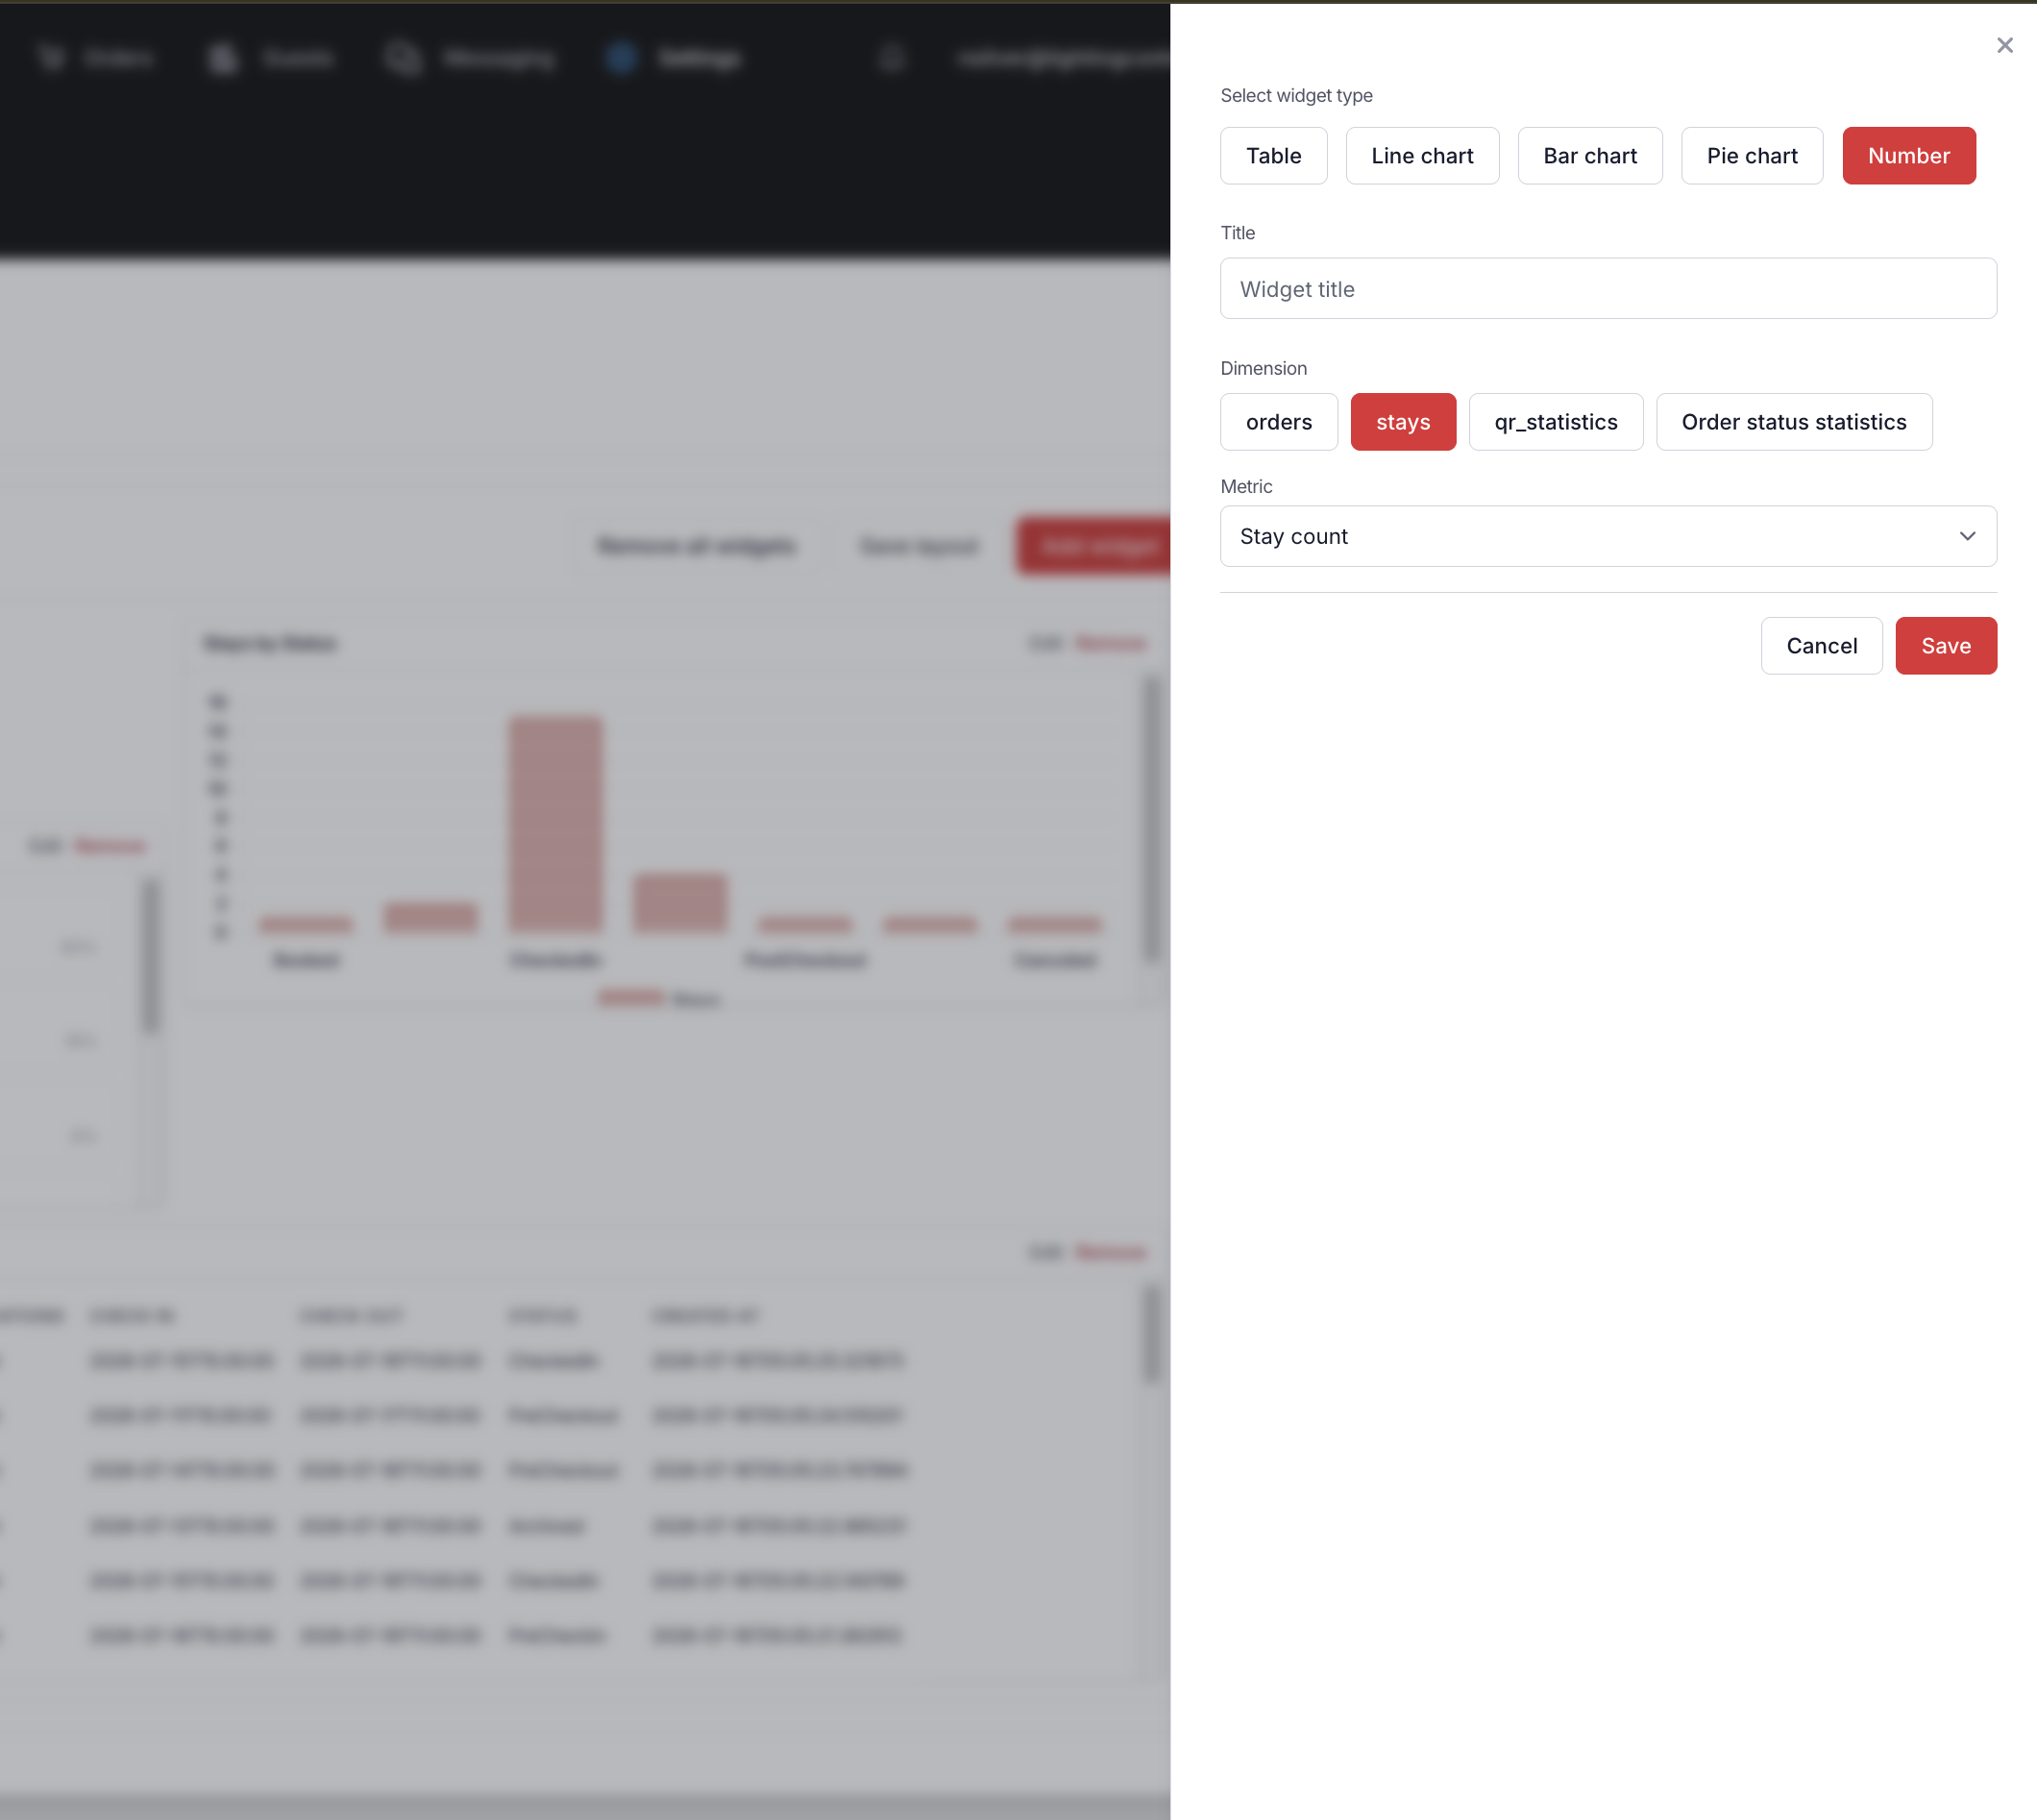
Select Add widget. The widget panel opens on the right.
-
Choose a widget type:
Type Shows Number A single headline figure, such as total revenue or order count. Table Rows of records with the columns you choose. Line chart A metric plotted over time. Bar chart A metric compared across categories. Pie chart A metric split into proportions by category. -
Choose a dataset — the source the widget reports on:
Dataset Reports on Orders Orders and their values. Order status statistics Order status changes, transition timings and rates. Stays Guest stays and their status. Occupancy Location occupancy. Locations Your locations. QR statistics QR code scans and visitors. Location climate Temperature and humidity readings. -
Choose the metric and fields for the widget — for example, which value to total for a Number, which columns to show in a Table, or which field to plot and how to group it for a chart.
-
Optionally add filters to narrow the data, and for time-based charts pick a timeframe of 7, 14 or 30 days.
-
For tables, select Preview to check the result before saving.
-
Save the widget. It's added to the canvas.
The datasets you can report on depend on what your Centro deployment collects. Stays and Occupancy, for example, are relevant to Hospitality deployments and may not carry data in others.
Number widgets that show a monetary value use the currency from your workspace's locale settings, so figures display in the currency your deployment is configured for.
Arranging and editing widgets
On the canvas you can:
- Move a widget by dragging it to a new position on the grid.
- Resize a widget by dragging its edge.
- Edit a widget's data or fields — select Edit on the widget to reopen its panel.
- Remove a widget you no longer need.
When the layout looks right, select Save layout. Nothing is kept until you save, so save before leaving the Content tab.
A dashboard can hold up to 100 widgets. Save your layout before navigating away — unsaved changes to the canvas are lost.
How users see the dashboard
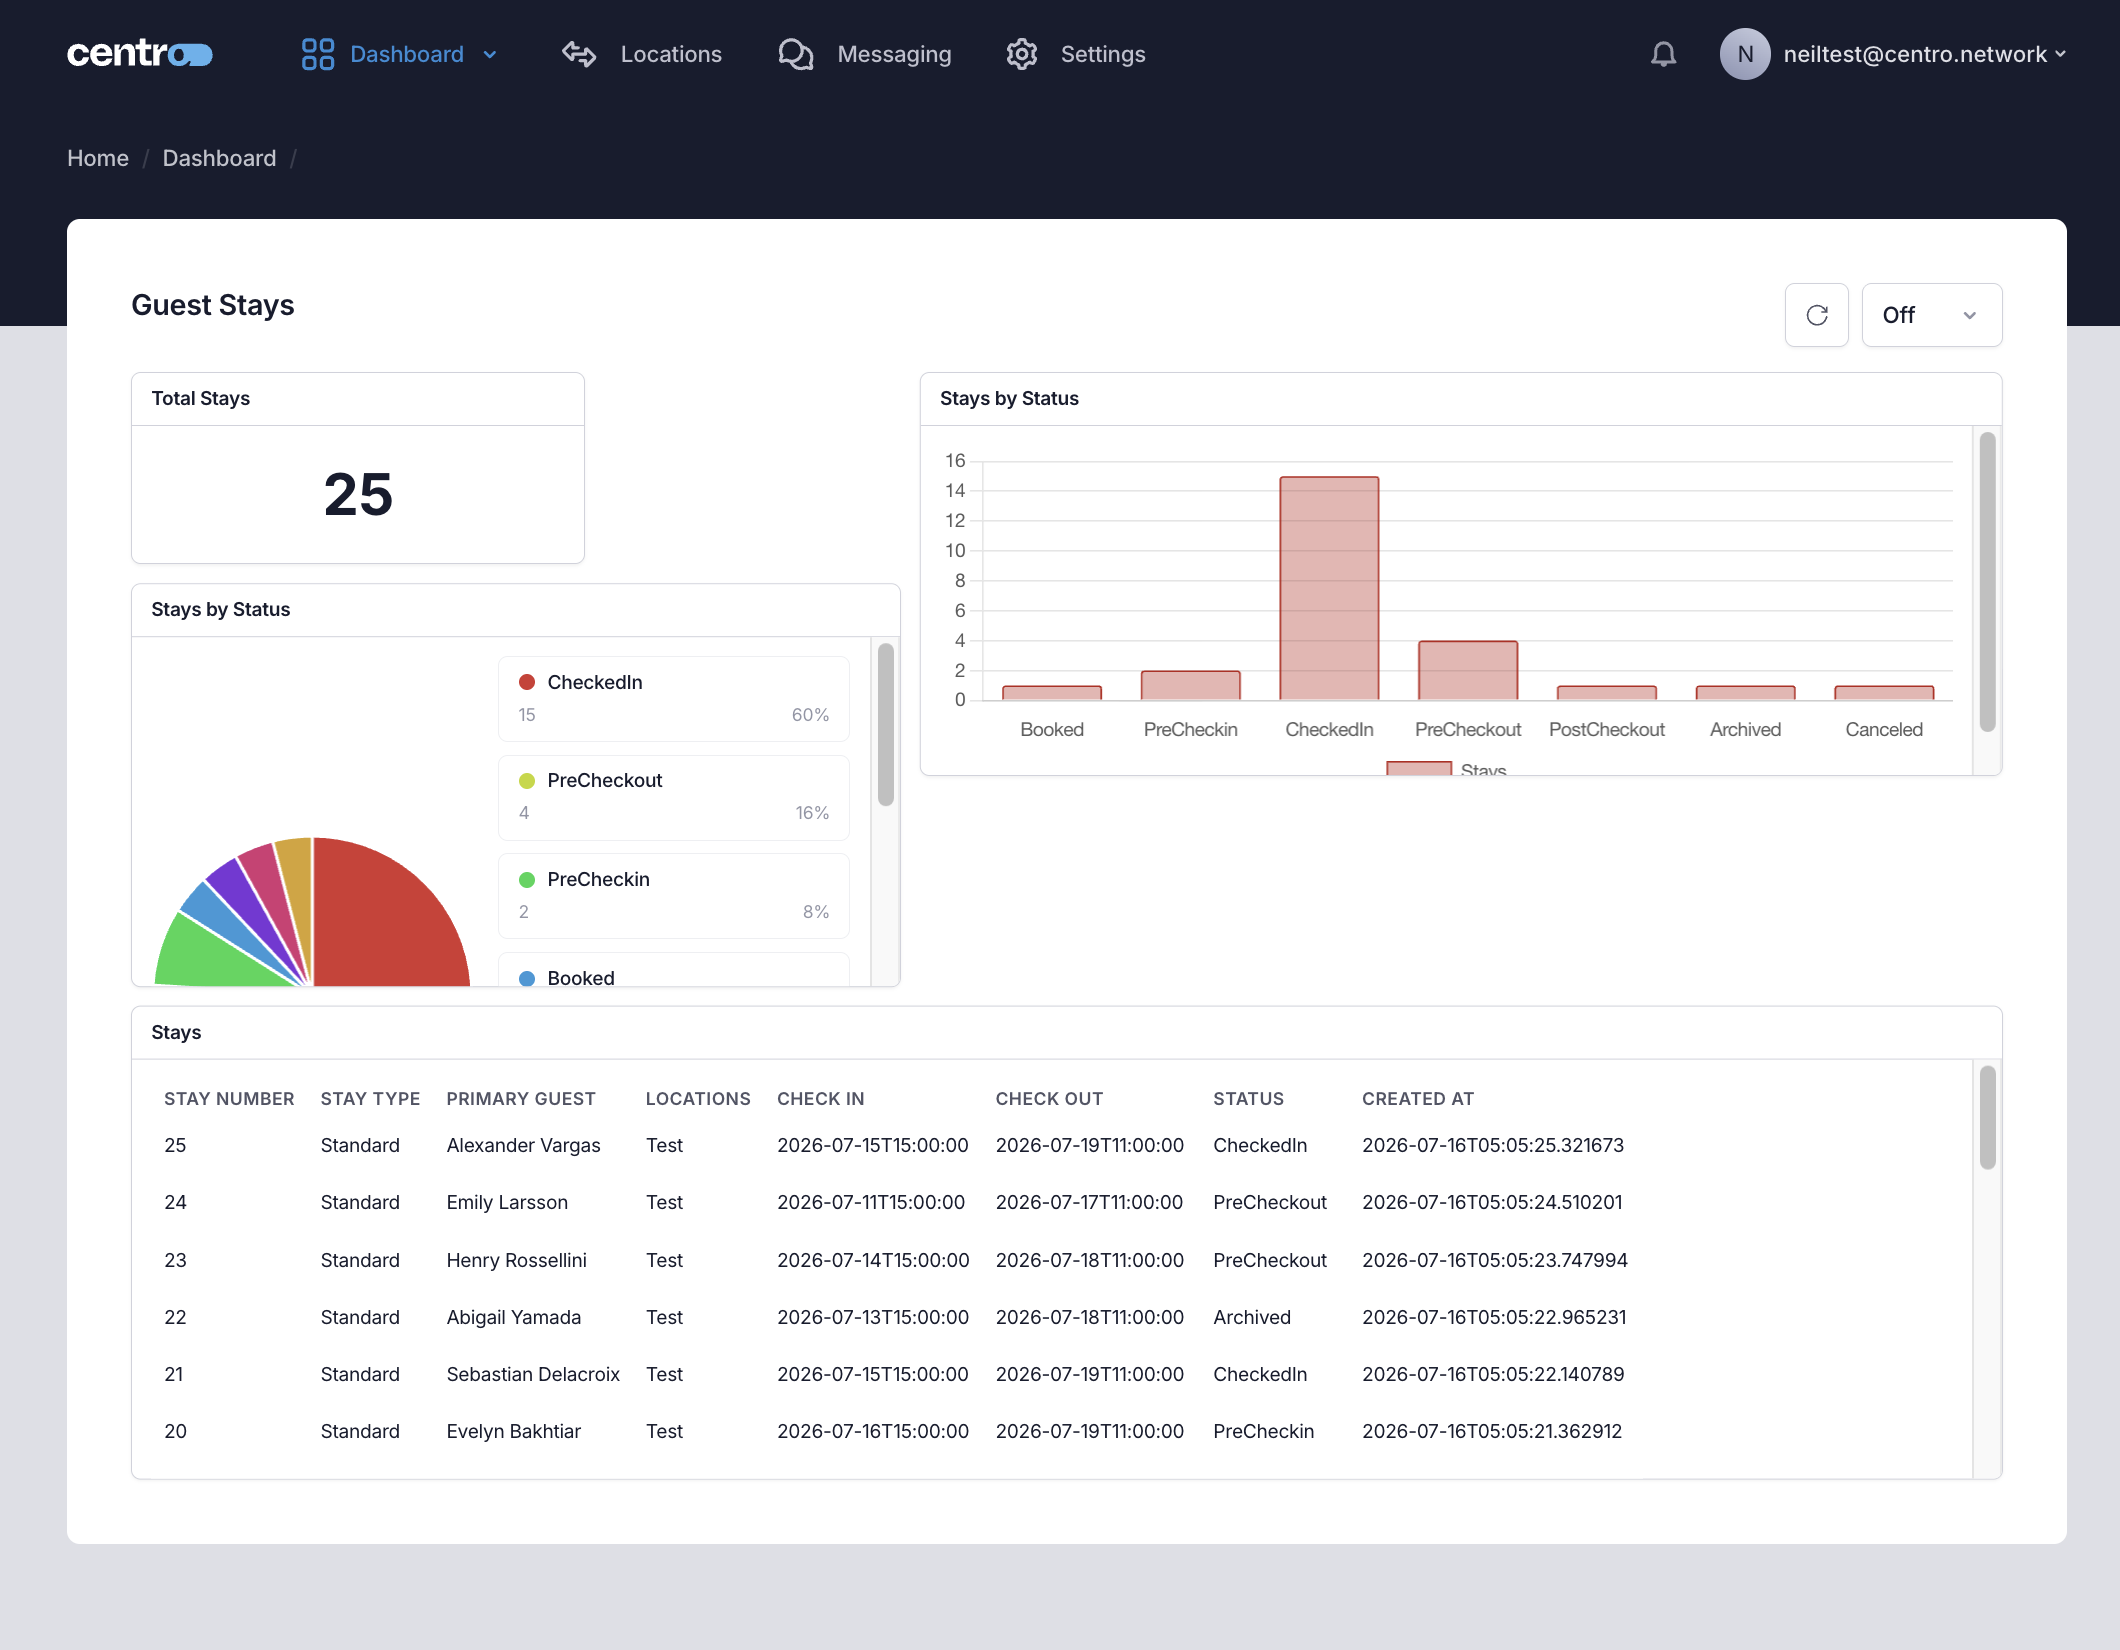
Users open the dashboard from the dashboard dropdown in their navigation and see the layout you built, in a read-only view. They can't change it, but they can:
- Refresh the dashboard to pull the latest figures.
- Set auto-refresh to update the figures automatically at an interval — from every 5 seconds up to every hour, or Off. This choice is remembered on their device.
A dashboard that has no saved layout yet shows a short "no layout" message instead of widgets, so build and save the layout before pointing users to it.